Enter the scroll bars pared with charting (click on image for full view):
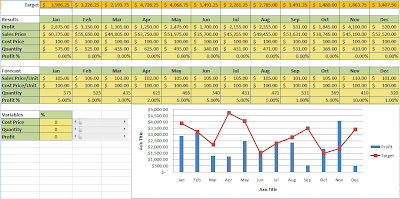


Did you notice how the chart to the lower right is impacted by the change in variables?
For the user, you simply one or more of the scroll bars up/down to increase or reduce these input values to see (in real time) the impact within the chart to the lower right. To create these scroll bars, you need to follow these 5 simple steps:
- From the developer ribbon select insert then choose the following:
- From the location you wish to locate this control click and drag to the size you wish this to be.
- Right click and select format control.
- From the control tab you can set your minimum and maximum values for this control and by what increment each click will change it.
- In cell link choose the destination for the value present in the scroll bar.

For a more about modeling with Excel 2007
No comments:
Post a Comment